Building a Goal Tree for Experimentation
Overview
Experimentation programs often struggle not because of a lack of ideas, but because teams are not aligned on which metrics actually matter.
Different teams optimize for different outcomes, teams define success inconsistently, and interpreting results is difficult. This leads to disconnected experiments and unclear impact.
A goal tree solves this.
It provides a structured way to align teams around shared outcomes and break down high-level business goals into measurable components that experimentation can directly improve.
What is a goal tree
A goal tree is a framework that connects business outcomes to the metrics and experiments that drive them.

Each level answers a different question:
-
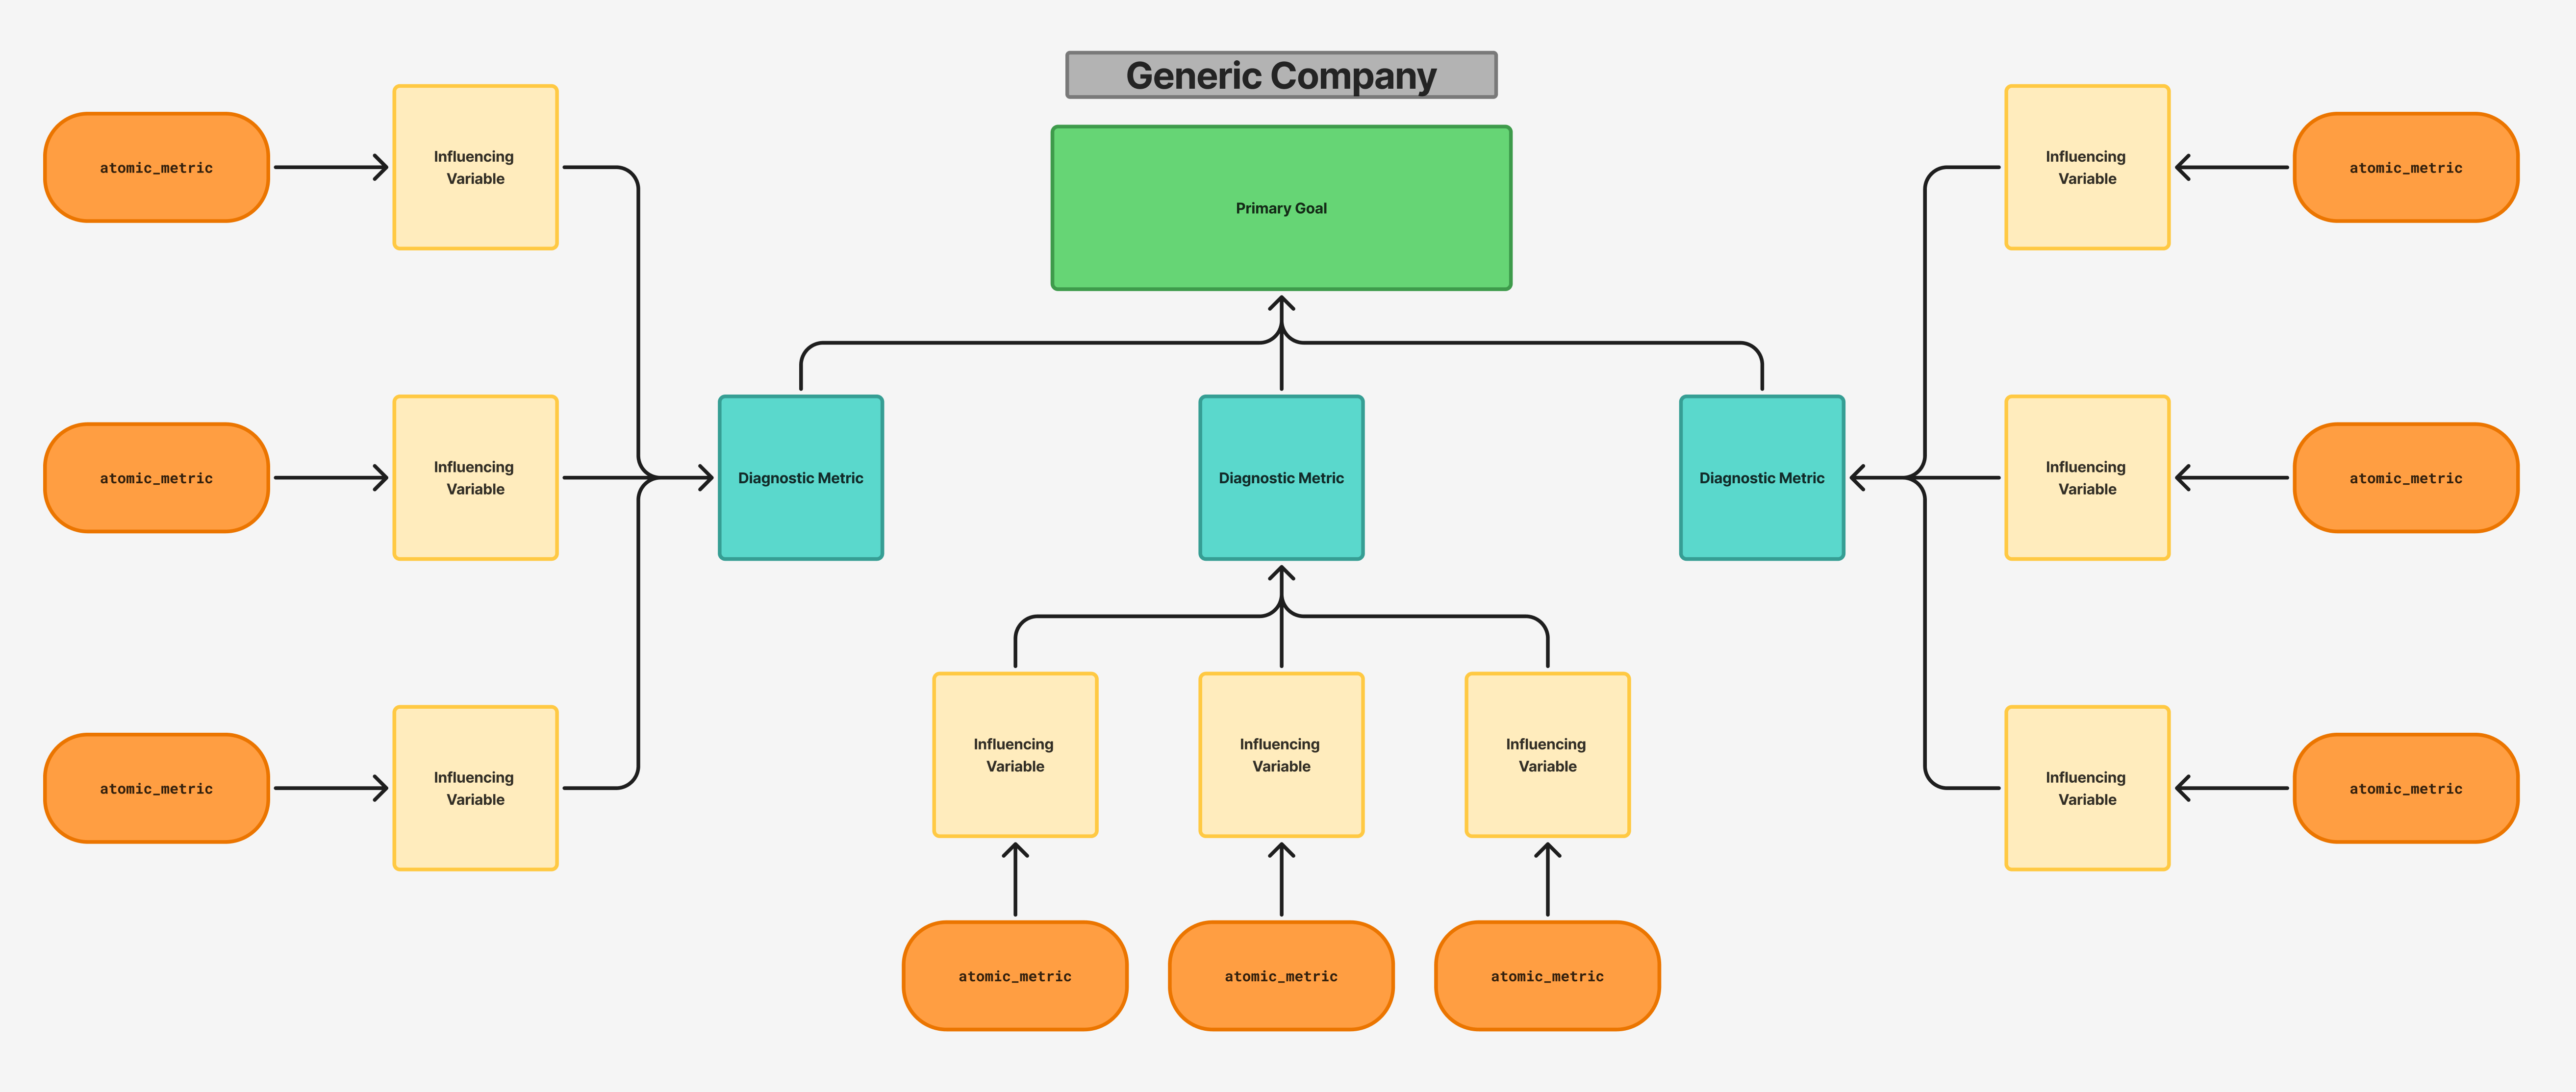
Primary goal, or key performance indicator (KPI) → What are we trying to achieve?
-
Diagnostic metrics → What are the key levers that drive this outcome?
-
Influencing variables → What user behaviors influence those levers?
-
Atomic metrics → What can we directly measure and experiment on?
Important distinction: goals vs. metrics
-
A metric is something you measure, for example, Revenue, Purchases, or Add to Cart events.
-
A goal is the change you want in that metric, for example, Increase Revenue by 15%.
Goal trees include both, but they serve different purposes.
Why goal trees matter
-
Align teams around shared outcomes.
-
Connect experiments to real business impact.
-
Make prioritization clearer.
-
Turn isolated tests into a coordinated system.
Anatomy of a goal tree
1. Primary goal
This is your top-level business outcome.
Examples:
-
Increase total revenue.
-
Increase monthly recurring revenue (MRR).
-
Increase customer lifetime value.
Behind every goal is a measurable metric, for example, Revenue or MRR, even if the exact target is tracked outside the tree.
2. Diagnostic metrics
These represent the core levers of your business model. They help explain why the primary goal moves.
Note: Diagnostic metrics can include derived metrics, for example, conversion rate, but should always be grounded in measurable underlying data.
| SaaS | E-commerce |
|---|---|
| Acquisition | Traffic (Sessions / Visitors) |
| Activation | Orders |
| Retention | Average Order Value |
| Expansion | Purchase Conversion Rate (derived) |
3. Influencing variables
Influencing variables describe the key user behaviors that drive your diagnostic metrics.
They are:
-
Closer to user behavior.
-
More actionable.
-
Where teams can influence change.
Examples:
-
Users view product pages.
-
Users add items to cart.
-
Users start checkout.
4. Atomic metrics
Atomic metrics are the most granular level of the tree.
They:
-
Represent specific user actions.
-
Are directly measurable.
-
Are where experiments typically happen.
Examples:
-
product_view -
add_to_cart -
checkout_started -
purchase
Derived metrics, for example, conversion rate, are calculated from atomic metrics and should not replace them.
Key insight
Improving atomic metrics leads to gains in influencing variables, which improve diagnostic metrics, and ultimately drive your primary goal.
Small improvements at the bottom of the tree add up to meaningful business impact.
Metric ownership
Each metric in your goal tree should have a clear owner to ensure accountability, faster decision-making, and focused experimentation. Without ownership, metrics stagnate and progress slows.
What kind of owner
Ownership should be a person or team, not a system.
The owner is responsible for:
-
Monitoring the metric regularly.
-
Interpreting changes and investigating anomalies.
-
Prioritizing experiments or actions to improve it.
Systems can collect and report metrics, but they cannot own outcomes.
How to choose an owner
Assign ownership to the person or team that:
-
Can directly influence the metric through changes or experiments.
-
Has the context to interpret why the metric moves.
-
Is accountable for outcomes, not just reporting.
Practical guidance
-
Diagnostic metrics → typically owned by a team, for example, Growth, Product, or Marketing.
-
Influencing variables → often owned by specific squads or functions.
-
Atomic metrics → owned by the team responsible for instrumentation and experimentation in that area.
If a metric has no clear owner, treat it as a gap to resolve before running experiments.
Running a goal tree workshop
Suggested agenda: 60–90 minutes
-
Define the primary goal (KPI).
-
Identify diagnostic metrics.
-
Map influencing variables.
-
Define atomic metrics.
-
Identify gaps in instrumentation, ownership, and experiments.
Facilitation tips
-
Start with problems, not metrics.
-
Focus on the most impactful drivers.
-
Involve cross-functional teams.
-
Push for clarity and measurability.
Expected outputs
-
A shared goal tree.
-
Clear metric ownership.
-
A defined set of measurable metrics across each level of the tree.
-
Identified gaps in instrumentation and measurement.
Common pitfalls
-
Confusing goals with metrics.
-
Using only derived metrics, for example, rates, without underlying measures.
-
Choosing metrics teams cannot influence.
-
Skipping the atomic level.
-
Lack of ownership.
Maintaining your goal tree
A goal tree is a living document, not a one-time artifact. Review it when:
-
Your business model or strategy changes.
-
A metric becomes unmeasurable or irrelevant.
-
A new team or product area is added.
-
The primary metric is hit or reset.
As a default, schedule a review every six months. Assign one person to own the tree overall, separate from individual metric owners, so there is always someone responsible for keeping it current.
Summary
A well-structured goal tree connects strategy to execution, linking business outcomes to measurable user behavior and experimentation opportunities.
Example goal trees
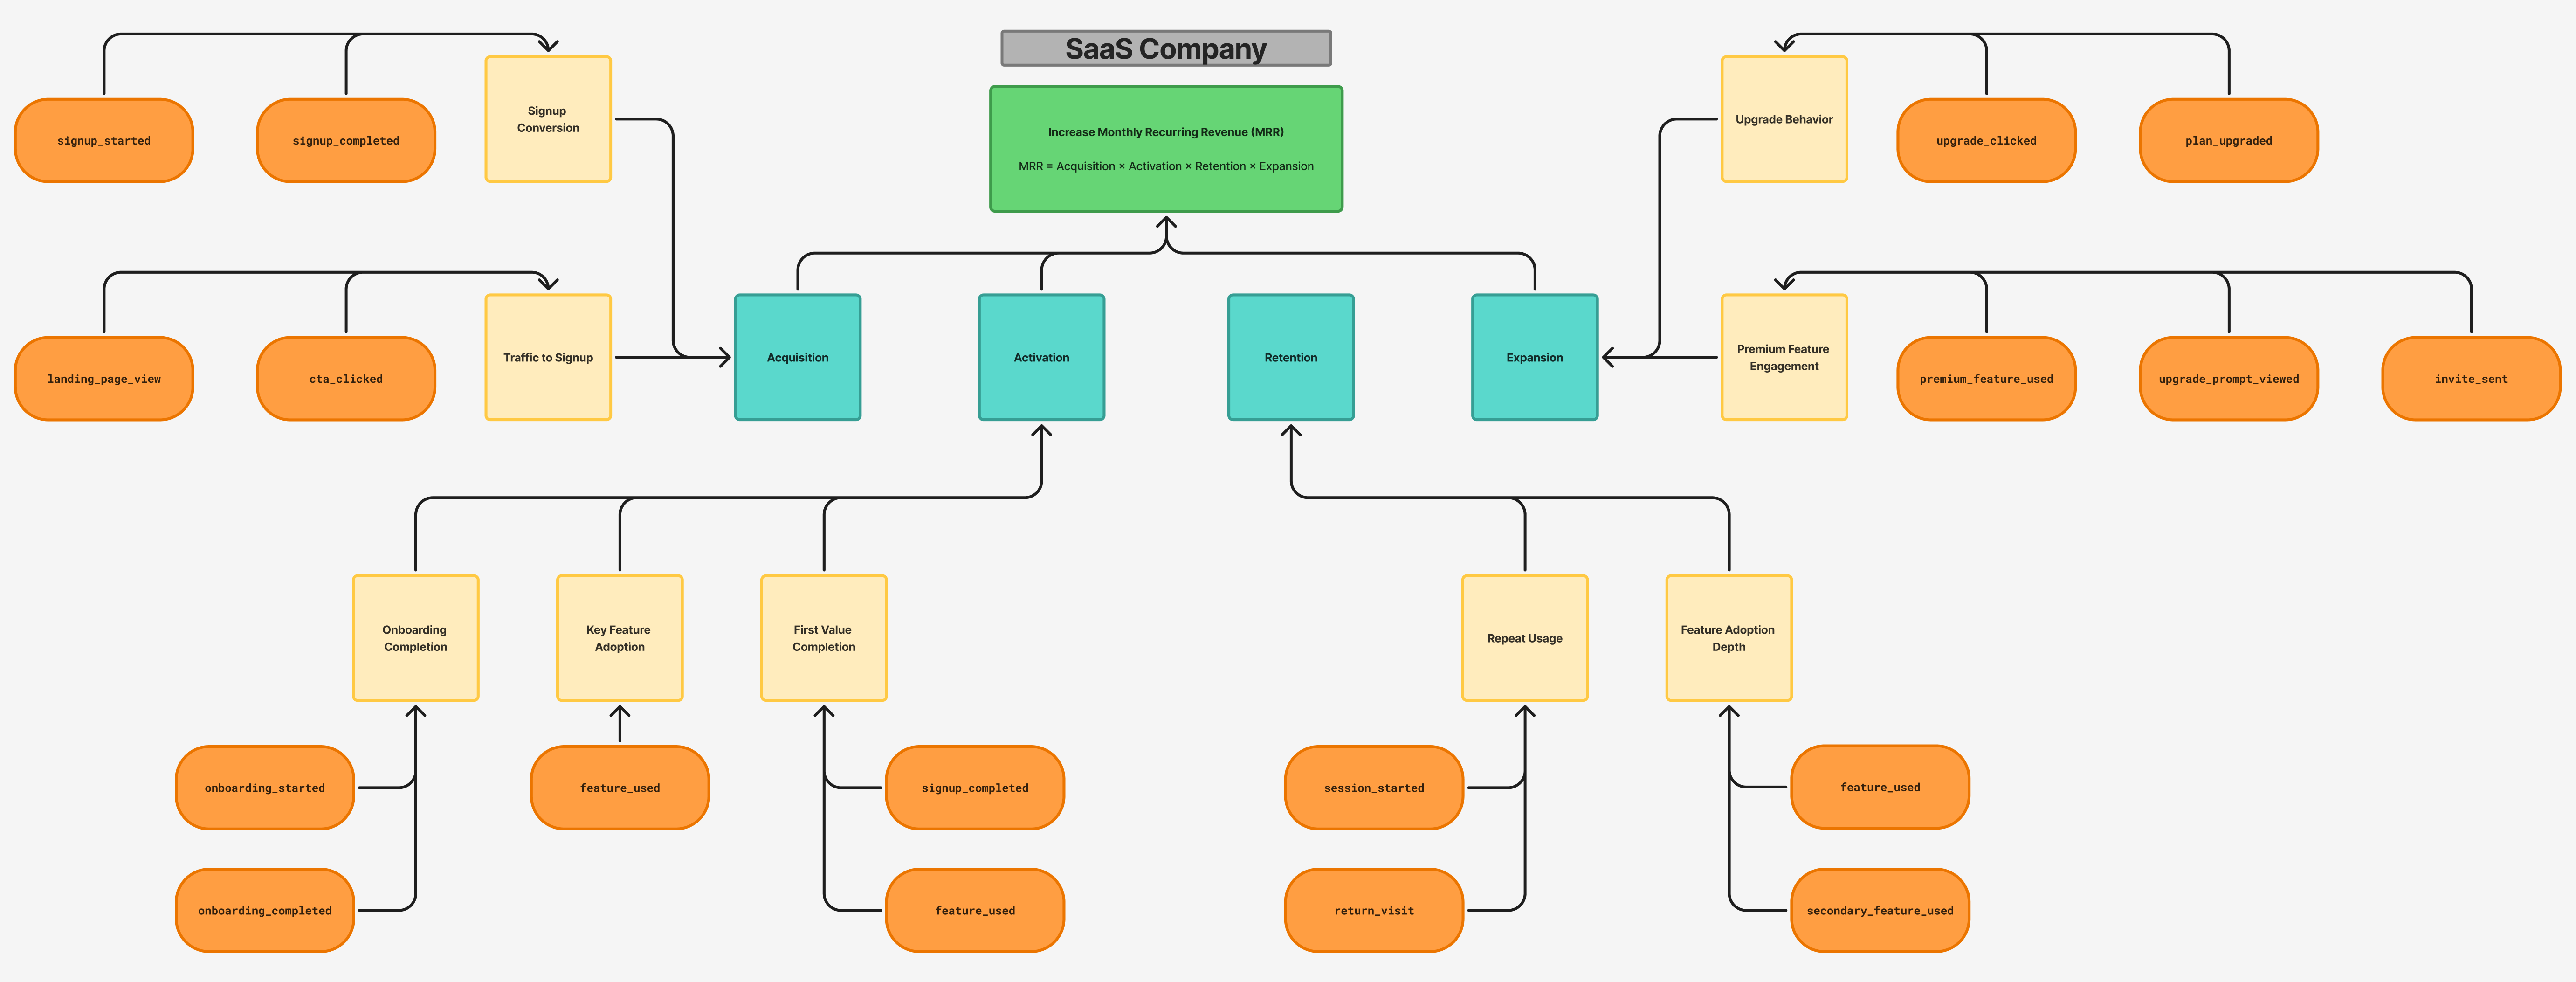
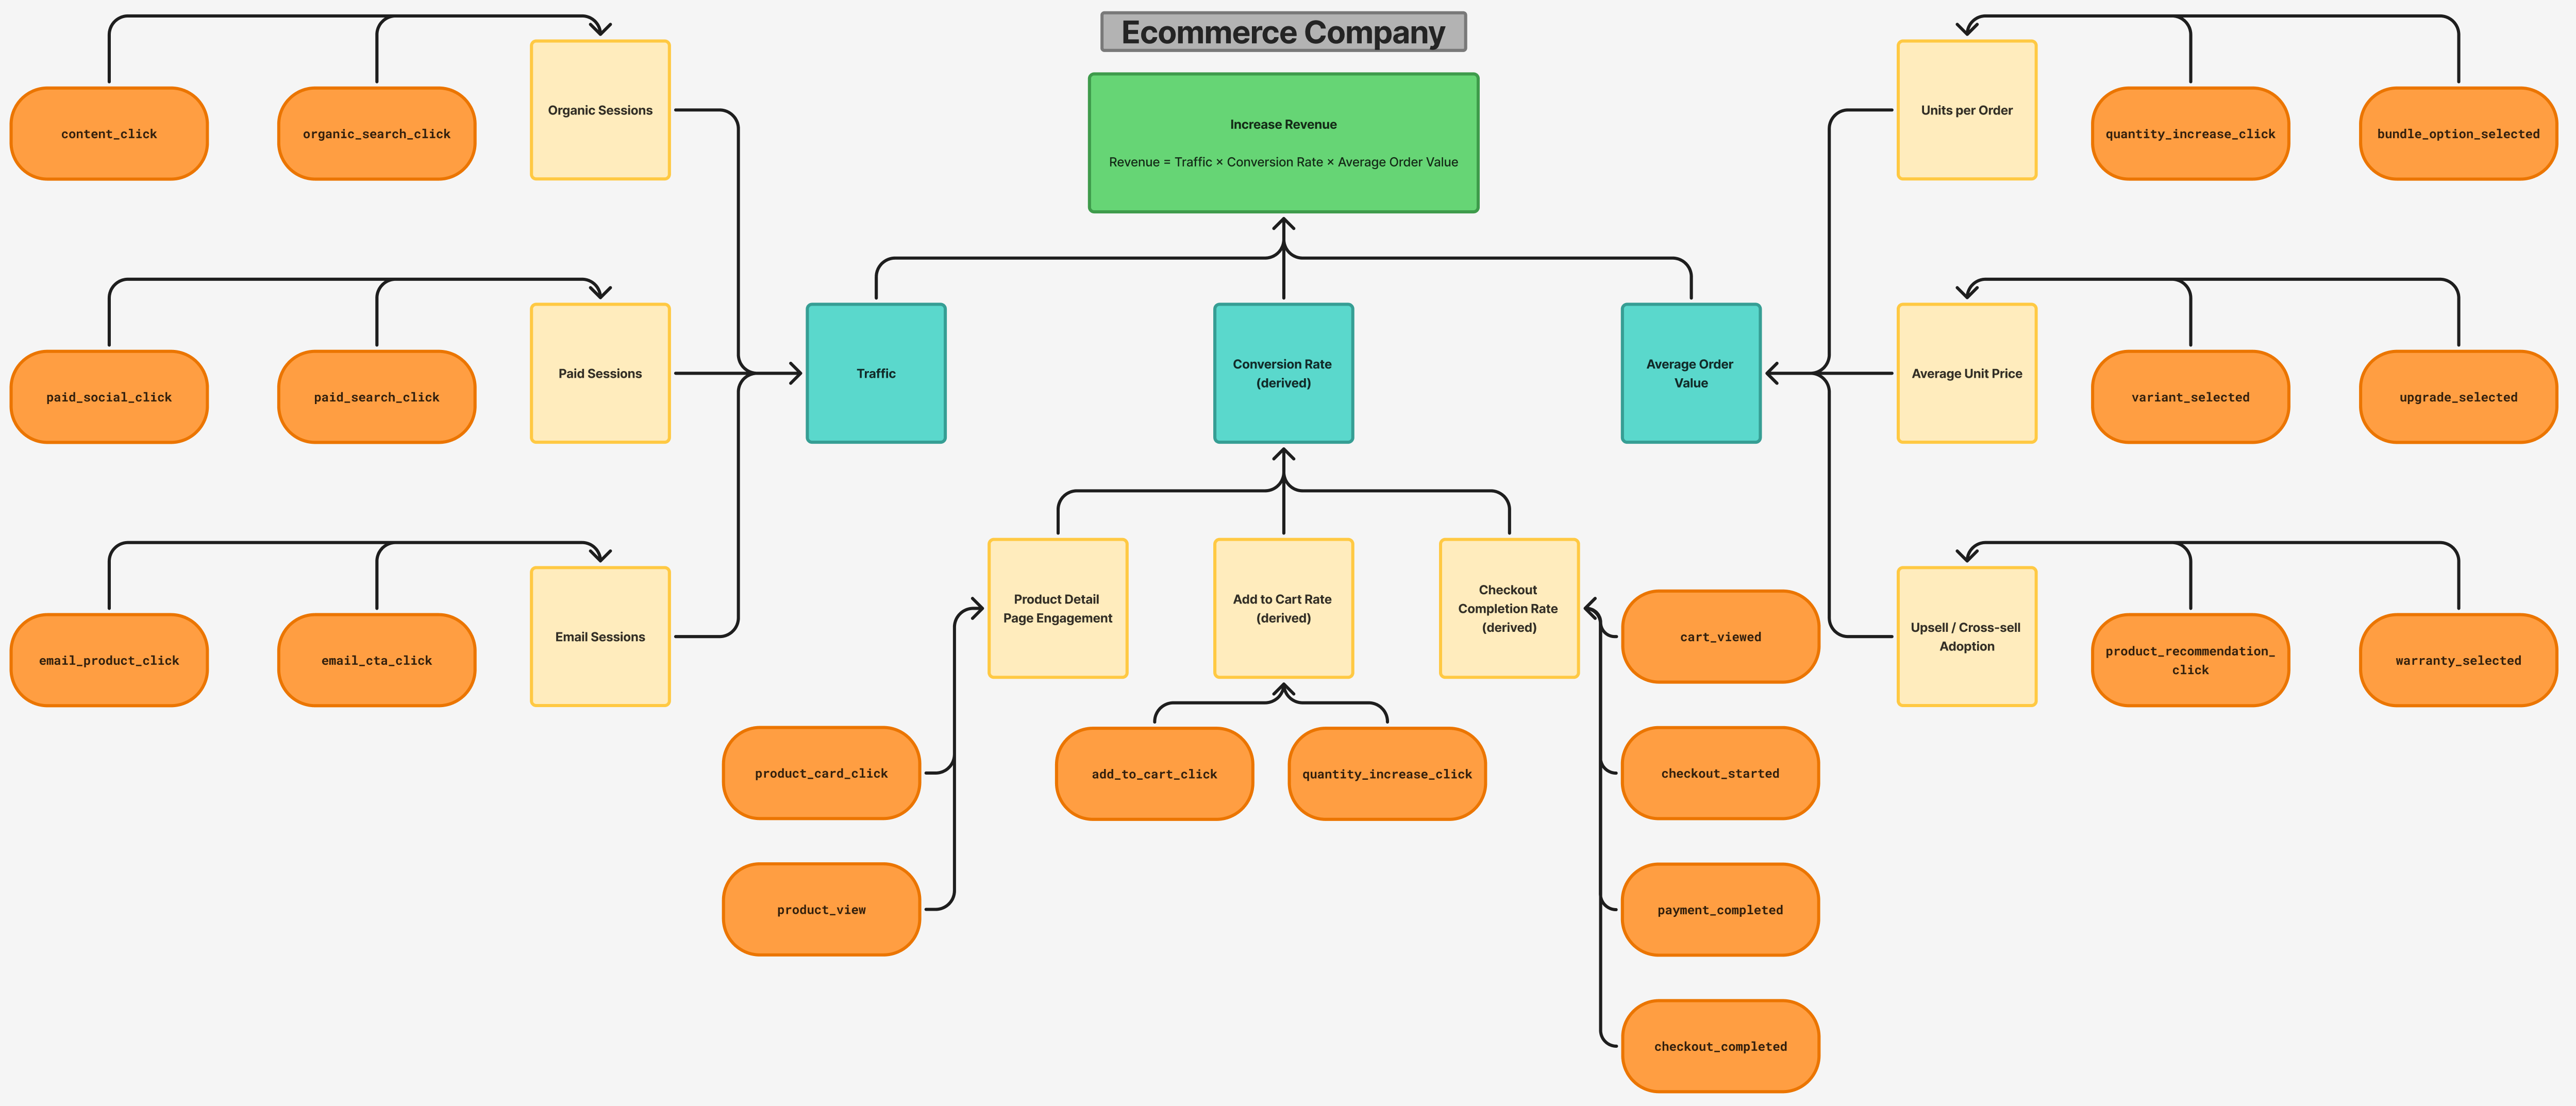
To explore visual examples, visit the Figma Template.
Generic company
Ecommerce company
SaaS company